


Don't want to trade it yourself?
Our desk runs DEX portfolios on profit share.
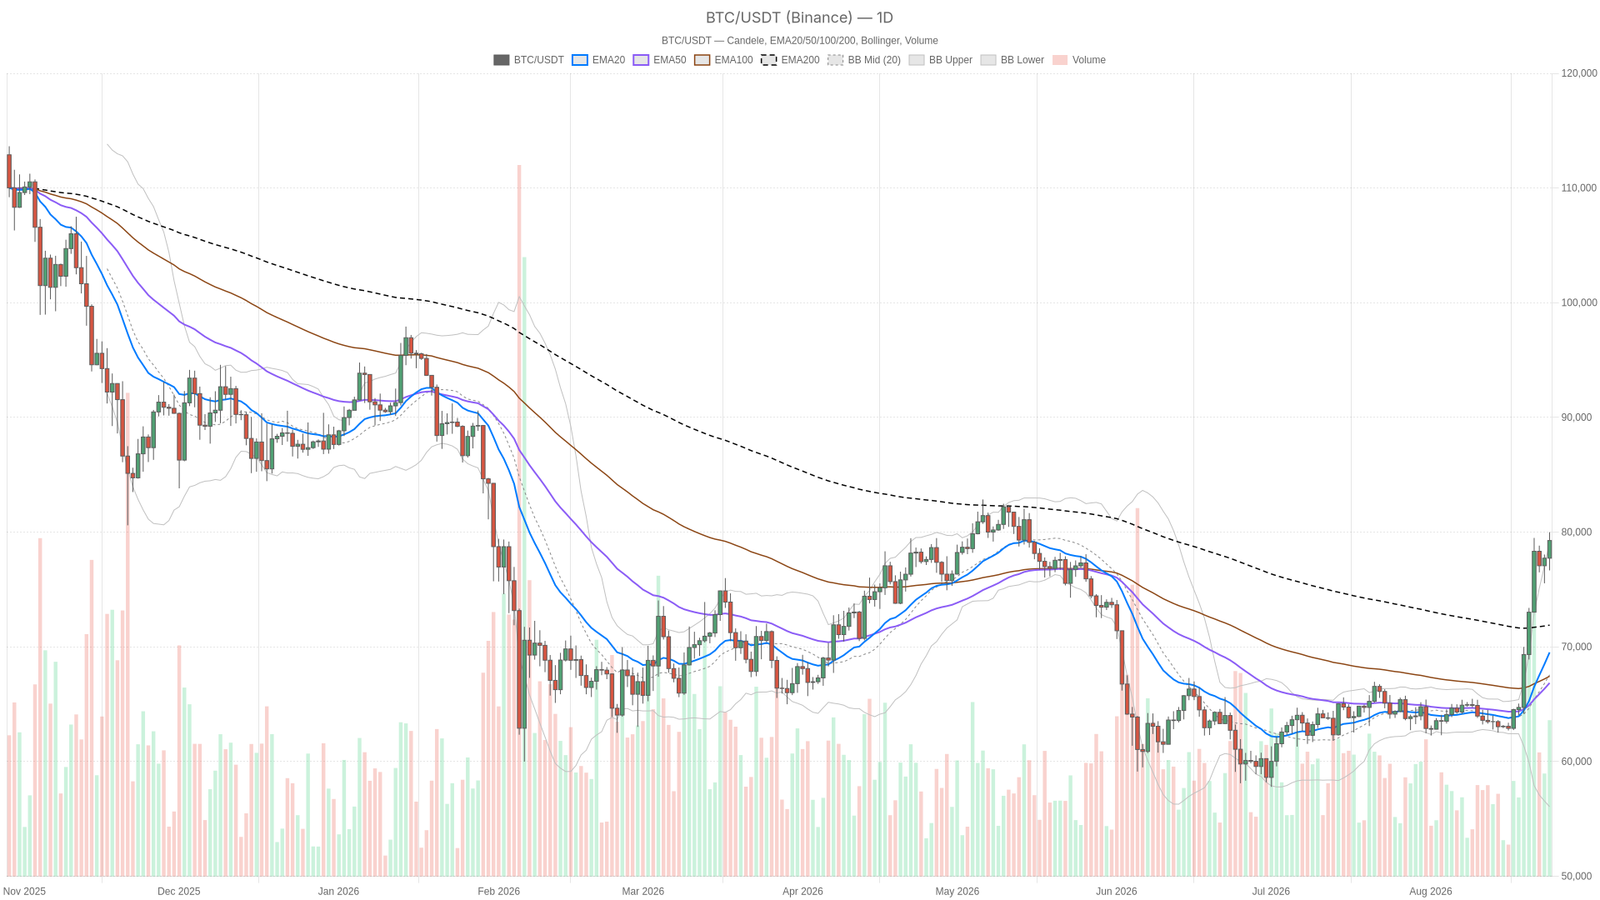
As of August 24, 2026, bitcoin ripped through $79,000 in its biggest three-day rally since 2023, closing at $79,271.70. The $BTC price now hovers just below the psychologically loaded $80,000 mark after a Treasury buyback operation crushed short positions betting on sub-$67,000 levels.
Key takeaways
- Bitcoin surged to $79,271.70 on August 24, 2026, in what CNBC called the biggest three-day rally since 2023.
- Daily RSI hit 82.45, deep in overbought territory, while the Fear & Greed Index registered 73 in “Greed” territory.
- A Treasury buyback operation triggered a massive short squeeze, breaking bitcoin out of its prior sub-$67,000 range.
- On-chain DEX activity surged over 200% weekly but showed daily cooling, mirroring the momentum fade on shorter timeframes.
- Bitcoin dominance reached 59.07% as capital concentrated into $BTC rather than lifting the broader crypto market.
Daily Structure: Bullish Trend, Overheated Momentum
The daily chart confirms a bullish price structure, but momentum indicators are deep in overbought territory, signaling that the move may be running ahead of its structural foundation.
Price at $79,271.70 sits above the EMA20 (69,523.67), EMA50 (66,856.77), and EMA200 (71,896.94). However, the EMA50 remains below the EMA200, meaning the slower moving averages have not yet flipped fully bullish. This is a fresh, fast move rather than a mature uptrend. Price got here through acceleration, not patience.
The daily RSI14 at 82.45 sits deep in overbought territory. Meanwhile, the MACD line (3,458.35) stands far above its signal (1,770.02), with a histogram of 1,688.34 confirming expanding momentum. That said, momentum this strong and this fast tends to invite exhaustion. It signals caution even while the trend remains intact. Price is also trading above the daily upper Bollinger Band (79,067.99), a classic sign of an extended move.
The daily ATR14 of 2,397.2 confirms this is a high-volatility tape where wide swings should be expected in both directions. The daily pivot sits at 78,647.24, with R1 at 80,624.46 and S1 at 77,294.47. Trading above the pivot keeps the bulls in control for now.
Lower Timeframes Confirm the Bias but Show Early Cracks
The 1-hour chart aligns fully with the bullish macro trend, yet the 15-minute chart reveals an early momentum rollover that advises against chasing the current price.
On the 1-hour chart, price at 79,308 sits above the EMA20 (78,091.34), EMA50 (77,386.72), and EMA200 (72,595.25). The moving averages form a fully aligned bullish stack. Moreover, RSI14 at 64.35 is firmly bullish without being stretched, and the MACD histogram (201.04) remains positive. Short-term momentum still pushes in the same direction as the daily trend.
The 15-minute chart, however, is where the first warning appears. Price (79,306.24) still holds above its EMA stack, and RSI14 at 58.08 looks unremarkable. Nevertheless, the MACD histogram has flipped negative (-20.47). The smallest timeframe momentum just rolled over even as price holds near recent highs. That is not a reversal signal on its own, but it provides a reasonable argument against chasing the current print. A pullback toward the 1H EMA20 (78,091) would offer a more disciplined entry context.
Market Context: Dominance, Sentiment and On-Chain Signals
Rising bitcoin dominance alongside a flat total crypto market cap confirms this is a $BTC-led rally rather than broad market euphoria, while on-chain data shows genuine activity that may already be cooling.
Bitcoin dominance sits at 59.07% of a total crypto market cap of roughly $2.673 trillion, according to CoinGecko-own just 0.07%. That combination suggests capital is concentrating into bitcoin. This pattern is consistent with a dominance-driven rally rather than altcoin-led euphoria
The Fear & Greed Index reads 73, classified as “Greed,” which aligns uncomfortably with the daily RSI overbought reading. Two independent measures of sentiment and momentum both flashing stretched simultaneously is worth taking seriously, even in an uptrend.
On-chain activity adds further texture. Uniswap V3 fees are up 455.69% over 7 days, Curve DEX fees up 270.97%, Fluid DEX up 285.83%, and Ekubo up 215.6%. This is genuine evidence the rally has real transactional activity behind it. However, the 1-day changes tell a different story. Uniswap V3 (-8.24%), Curve (-13.96%), Fluid (-7.47%), and Ekubo (-19.61%) are all pulling back. Only Uniswap V4 (+9.68%) is still climbing. That cooling in daily on-chain activity echoes the momentum fade visible on the 15-minute MACD.
Bullish Scenario
If $BTC holds above the daily pivot and clears R1, continuation toward new highs becomes the base case, supported by rising dominance and fresh short-squeeze dynamics. Provided the $BTC price holds above the daily pivot at 78,647.24 and clears R1 at 80,624.46, continuation toward new highs becomes the base case. This is particularly true with dominance rising and the short-squeeze mechanics around the Treasury buyback still fresh. Confirmation would come from the 1H chart holding its EMA20 (78,091.34) on any dip, with RSI staying above the 50 line. This scenario gets invalidated in the near term if price loses the 1H EMA20, which would suggest the squeeze is running out of fuel.
Bearish / Mean-Reversion Scenario
The case for a pullback rests squarely on the daily RSI at 82.45, price above the upper Bollinger Band, and elevated ATR, all pointing to an overextended move due for mean reversion. A retracement toward the daily Bollinger mid (67,569.14), or more conservatively toward S1 at 77,294.47, is a reasonable scenario purely on stretch alone. This view is invalidated if price continues to walk the upper Bollinger Band without tagging it from below. In other words, if momentum simply overrides the overbought condition, which does happen in genuine squeeze-driven markets. Watch the 1H RSI: as long as it holds above 50 on any dip, the mean-reversion case does not get triggered.
Positioning and Risk
With daily and hourly trends bullish but overheated, and the smallest timeframe already wobbling, traders should treat volatility as a variable to manage rather than as background noise. This is a market where the daily trend, the 1H trend, and the 15m execution picture are not fully aligned. The bigger timeframes are bullish but overheated. Meanwhile, the smallest timeframe already shows a momentum wobble. That is not a contradiction to dismiss. It is the market signaling that upside continuation and a sharp pullback are both live outcomes. Given the elevated ATR readings on both daily and hourly charts, volatility itself must be treated as a variable to manage. Whatever view you take, the overbought daily RSI combined with an extreme Greed reading means this is a moment for discipline around position sizing and invalidation levels.
What is driving the current bitcoin rally?
A Treasury buyback operation triggered a massive short squeeze, according to Fortune’s reporting, blowing up positions that had been betting bitcoin would stay below $67,000. CNBC described the move as the biggest three-day rally since 2023. Beyond positioning mechanics, Ray Dalio’s comments linking the move to an approaching debt crisis gave the rally a macro narrative tied to debasement concerns.
Is bitcoin overbought right now?
Yes, by multiple measures. The daily RSI14 sits at 82.45, deep into overbought territory, and price is trading above the daily upper Bollinger Band (79,067.99). Meanwhile, the Fear & Greed Index reads 73 in “Greed” territory. Two independent measures both flashing stretched simultaneously strengthens the case that the move is extended, even if the underlying trend remains bullish.
What are the key levels to watch?
On the upside, R1 at 80,624.46 is the next logical magnet if the squeeze continues. On the downside, the daily pivot at 78,647.24 is the first support to hold for bulls. Below that, S1 at 77,294.47 and the 1H EMA20 at 78,091.34 are critical invalidation points. A deeper retracement could target the daily Bollinger mid at 67,569.14.
Is this rally sustainable?
The rally has genuine on-chain activity behind it, with DEX fees surging over 200% weekly across multiple protocols. However, the daily cooling in those same on-chain metrics, combined with the 15-minute MACD turning negative, suggests the initial burst may be past its most intense phase. The gap between strong momentum and lagging structural trend indicators, like the EMA50 still below the EMA200, adds further reason for caution.
Disclaimer: This article is for informational purposes only and does not constitute financial advice, an investment recommendation, or a solicitation to buy or sell any financial instrument or cryptocurrency. The analysis provided is not indicative of future results. Investing in crypto assets and financial markets carries a high risk of capital loss. Always do your own research (DYOR) and consult a qualified financial advisor before making any decision.
Article produced with the assistance of artificial intelligence and reviewed by the editorial team.
Source: cryptonews.net
1 Comment
Pingback: Ethereum Price Forecast, Prediction: Global Bank Sees $4,000 As ETH Surges 32% – xpertsstudio