


Don't want to trade it yourself?
Our desk runs DEX portfolios on profit share.
ArticlesClassGlossaryVideos
Beginner
Crypto Market Analysis Today (August 24, 2026): The US Treasury Doubles Its Bond Buybacks, and the Crypto Market Surges
Update 24 Aug 2026 • Reading Time 8 Minute
Reading Time:8minutes
Toward the end of August, the crypto market recorded a significant advance following an announcement concerning the doubling of long-dated bond repurchases. That move was followed by the largest liquidation of short positions CoinDesk has recorded since 2021, together with the strongest ETF inflows of the past ten months. This weekly market analysis examines market conditions over the week, the macro factors that influenced the move, the technical levels of major assets such as BTC, ETH, and SOL, as well as capital flows from institutional investors.
Article Summary
- 📈 Bitcoin reclaimed the $72,928.7 level, ETH broke through resistance at $2,371.69, while SOL faces resistance at $95.
- 🏦 Spot Bitcoin ETFs absorbed net inflows of $1.92 billion over the week, while Ethereum ETFs took in $697.18 million, the largest combined figure since October 2025.
- 💥 Short positions worth $2.74 billion were liquidated within 24 hours on August 19 to 20, the largest wave in CoinDesk’s records since 2021.
- 🏛️ The US Treasury raised the limit on its buyback operations for bonds in the 10 to 30 year tenors from $2 billion to $4 billion, effective September 9.
Market Conditions This Week (August 24)
Fear and Greed Index on CoinMarketCap: 77 (Greed).
One point in this table deserves attention: a large advance does not always mean a break of the resistance level. ETH managed to clear the $2,371.69 resistance that had held it for two months, while BTC remains 2.98% below its next resistance and SOL sits 4.31% below its own resistance level.
Macroeconomic Analysis: The US Treasury Doubles Its Bond Buybacks as Yields Touch a 20-Month High
On August 19 the institution announced an increase in the size limit for nominal long-end bond buyback operations from $2 billion to at least $4 billion, covering the 10 to 20 year and 20 to 30 year tenors, effective September 9 through November 4, 2026. The stated reason is to provide greater liquidity support in the long-dated segment.
The market did not read that announcement as good news for bonds. The US dollar index weakened by approximately 1% over the week to 98.793, while gold broke above $4,600 per ounce and silver approached $70 per ounce One possible trigger is the conclusion that the US government has to intervene in order to contain its long-term borrowing costs, and a conclusion of that kind generally shifts interest toward assets whose supply cannot be expanded through policy
The probability of the Federal Reserve raising interest rates at its September meeting instead rose to 40% from 33% a week earlier with annual US inflation still at 3.4% in July. Risk assets advanced precisely as the odds of tightening increased. A combination of that kind points to one conclusion, namely that the market is trading liquidity conditions and the purchasing power of the currency
US Macroeconomic Calendar
Crypto Market Analysis Today: BTC, ETH, and SOL Technicals
BTC: Price Reclaims $72,928.7 and Halts Below the 61.80% Fibonacci
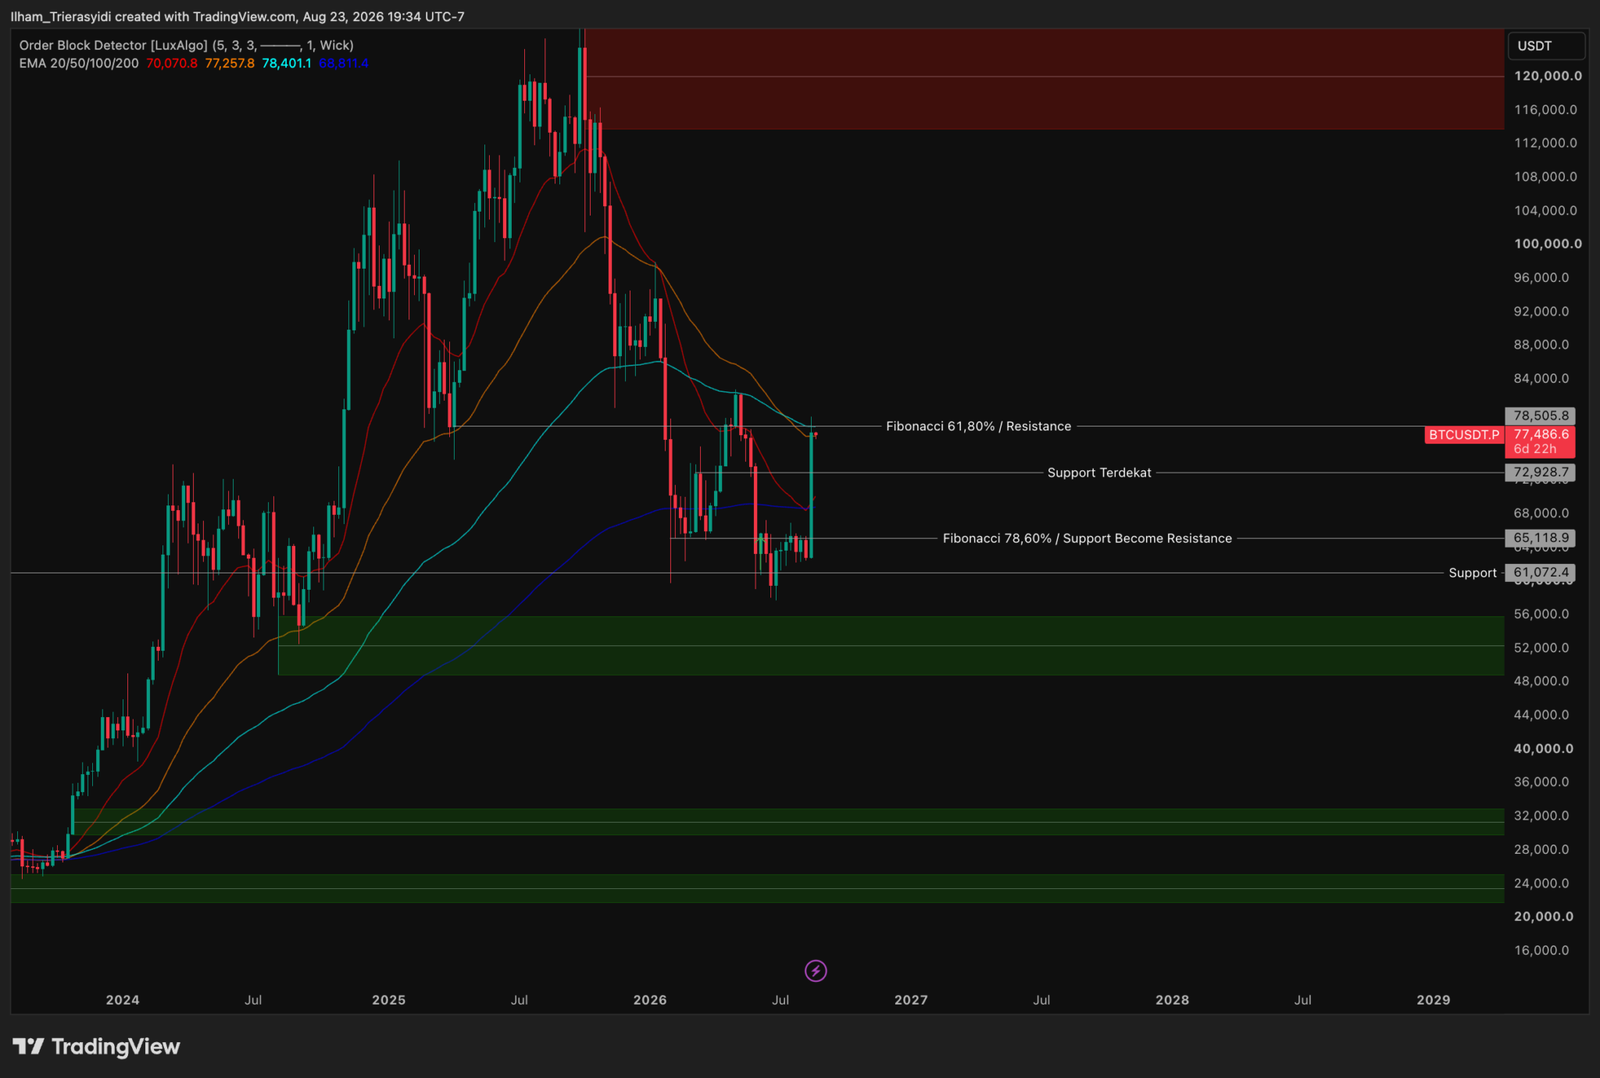
BTC was recorded clearing two important levels within a single week, namely the 78.60% Fibonacci at $65,118.9, which had previously flipped into resistance, and then the nearest support at $72,928.7. Its position now sits precisely between the 50 EMA at $77,257.8 and the 100 EMA at $78,401.1, two lines that have consistently stood above price since the start of the year.
- Nearest resistance: $78,505.8.
- Nearest support: $72,928.7.
- Secondary support: $65,118.9.
ETH: Resistance at $2,371.69 Finally Breaks After Two Months of Rejection
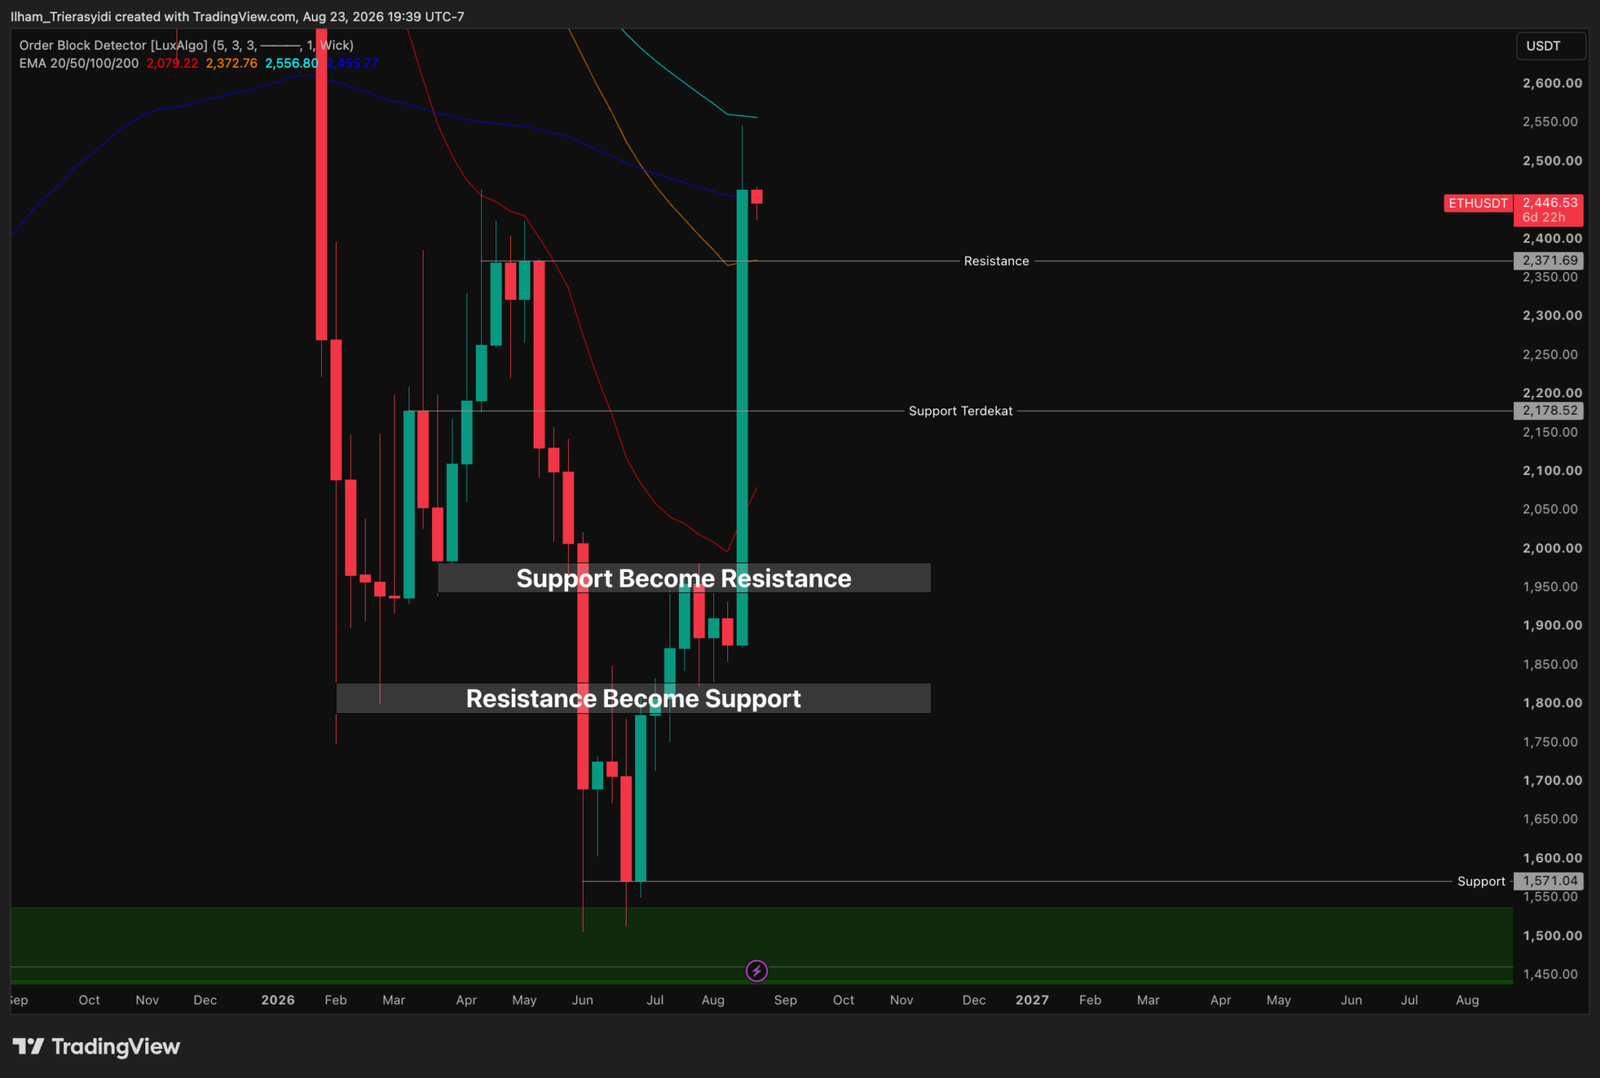
ETH managed to break through two zones that had previously obstructed any continuation higher, namely the $1,940 to $1,980 area read as support become resistance and the $2,371.69 level. Price is now moving around the 200 EMA at $2,455.77, with the 100 EMA at $2,556.80 as the next obstacle.
- Nearest resistance: approximately $2,455 to $2,557, the range between the 200 EMA and the 100 EMA.
- Resistance Become Support: $2,371.69, the level that has just flipped from resistance into support.
SOL: Price Enters the Supply Zone and Halts Below Resistance at $96.33
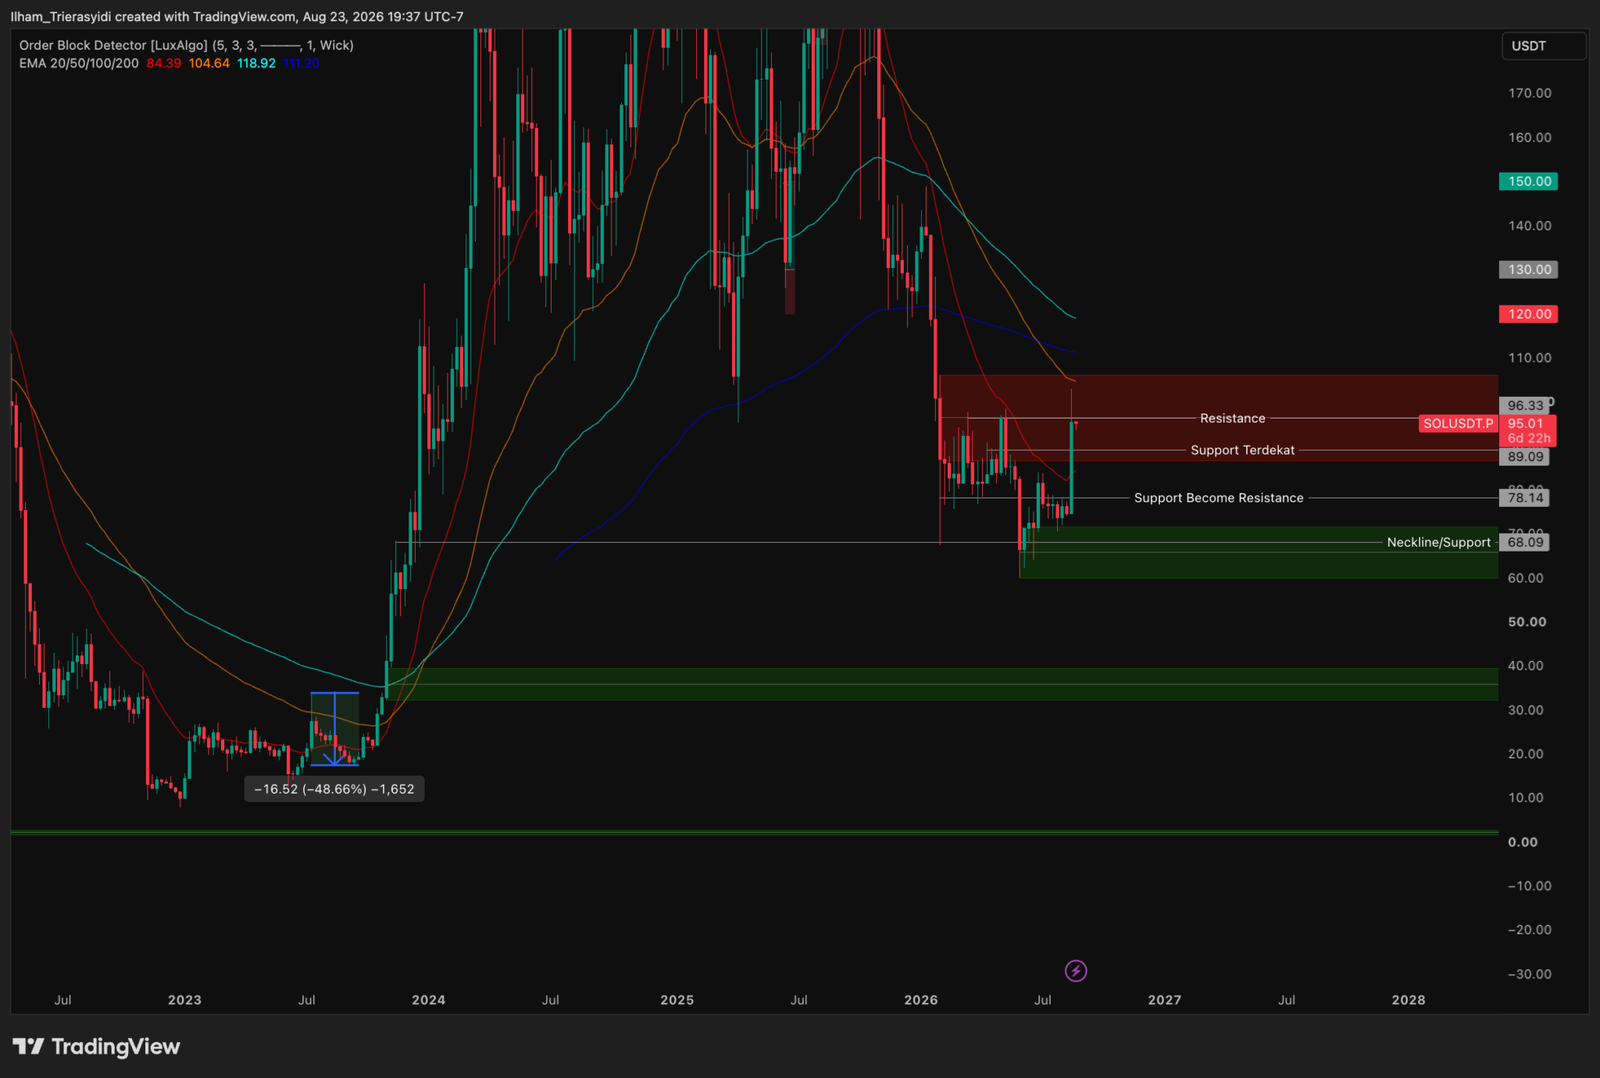
SOL advanced from the $78.14 zone that had held it throughout July and moved into the red supply zone spanning approximately $86 to $107. The asset lags because its price remains well below the 50 EMA at $104.64, while BTC and ETH have already touched their medium-term EMAs.
- Nearest resistance: $96.33.
- Nearest support: $89.09, the first support marker below price.
On-Chain Data and Institutional Capital Flows
Spot ETF Flows
Spot Bitcoin ETFs recorded five consecutive days of net inflows from August 17 to 21, totalling $1.92 billion peaking at $606.29 million on August 20. The preceding week was instead negative by $389.70 million, so the reversal amounts to more than $2.3 billion within a single week
Total assets under management rose from $76.61 billion on August 14 to $96.07 billion on August 21, with cumulative inflows since launch reaching $53.71 billion. Liquidity increased alongside it, as the weekly traded value of these products reached $22.14 billion from $6.94 billion a week earlier.
📚 Learn about Apa itu Bitcoin ETF Flow dan Pengaruhnya Terhadap Harga BTC from Pintu Academy to understand how to read these inflow and outflow figures.
On-Chain Data
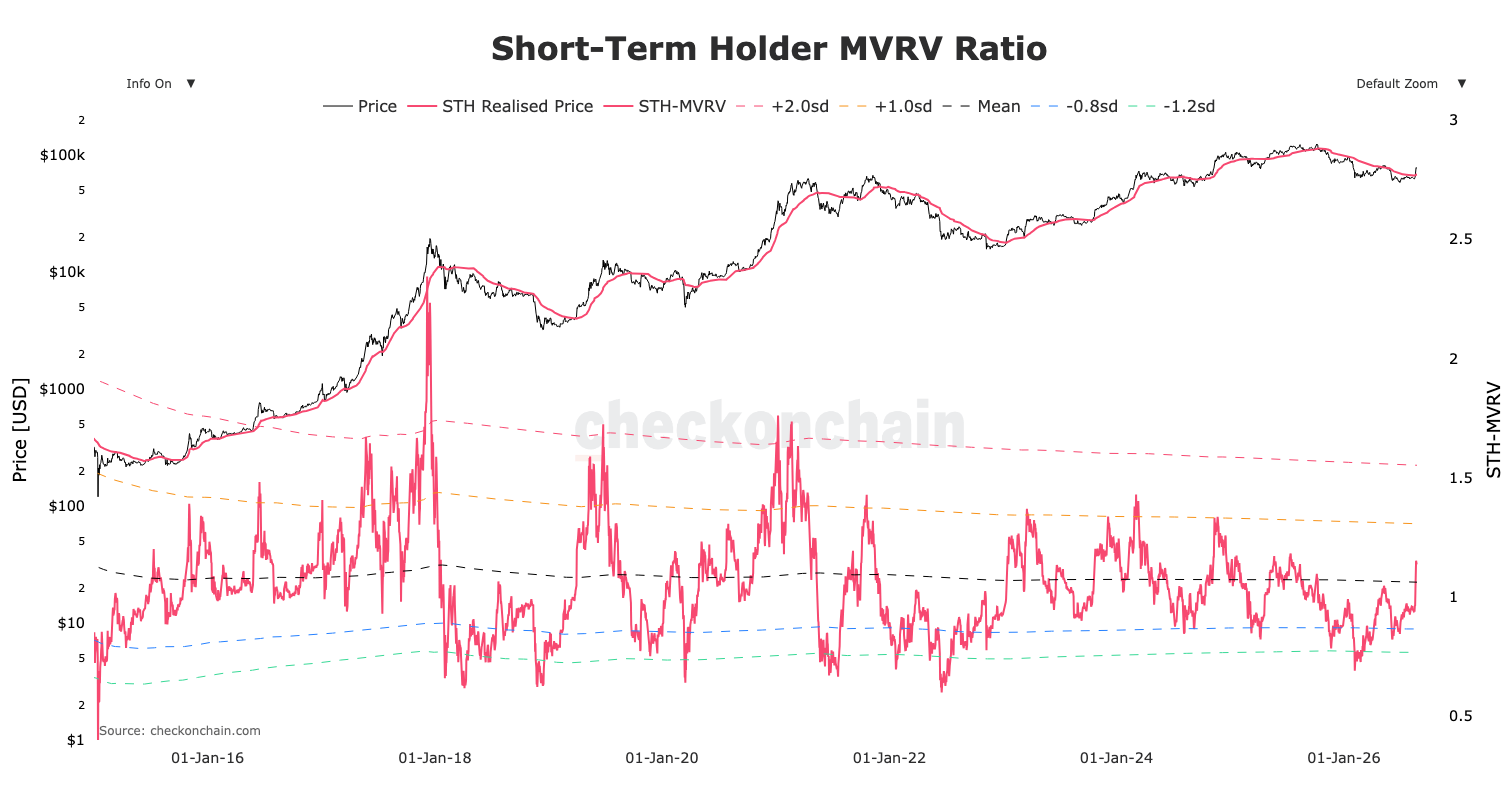
Short Term Holder MVRV compares the market price with the average acquisition price of BTC that changed hands over the past 155 days, so the ratio describes whether new buyers are in profit or at a loss. The chart rises sharply at the final data point, moving from below the historical mean line into the area between the mean and the first positive standard deviation. That means the most recent group of buyers shifted from a loss into a profit within a matter of days, a condition that historically tends to be followed by selling pressure from short-term holders who lock in gains quickly.
Key Crypto News of the Week
- Liquidations of short positions break a record. Short positions worth $2.74 billion were force closed within 24 hours on August 19 to 20 according to CoinDesk, exceeding the $2.47 billion recorded when the market experienced a crash on October 10, 2025, and becoming the largest wave in records since 2021. The breakdown comprises $1.42 billion in Bitcoin, $1.13 billion in Ethereum, and $104.67 million in Solana, with a total of 172,108 accounts affected and approximately 92% of them short positions. A further $1.2 billion followed the next day.
- Trump pushes the CLARITY Act. The US President asked Congress to expedite the Digital Asset Market Clarity Act during a meeting with crypto industry participants at the White House on August 19, the same day as the Treasury buyback announcement.
- Ethena rises 98.5% over the week. ENA became the best performing asset in the top 100 following the announcement of a $1 billion lending facility with FalconX, with the rally beginning on August 18 from around $0.082 and Arthur Hayes publishing his bullish thesis on August 20.
- BlackRock absorbs the majority of ETF flows. The IBIT product drew $1.33 billion of the $1.92 billion in total weekly inflows into Bitcoin ETFs, while ETHA absorbed $536.8 million of the $697.18 million on the Ethereum side.
Best and Worst Performing Crypto Assets Over the Past Week
The period from July 17 to August 23, 2026 for the top 100 crypto assets
- Ethena : +98.5%
- **Pump.fun (PUMP):** +87.4%
- Zcash : +72.3%
- Aave : +61.5%
- World Liberty Financial : -2.6%
- MemeCore : -2.0%
- HTX DAO (HTX): -2.0%
- Ondo US Dollar Yield (USDY): -0.3%
Disclaimer
All information presented in this article has been compiled for educational and general informational purposes. This content is not intended as investment advice, a recommendation, an invitation to buy or sell any particular crypto asset, or a basis for financial decision making. Every investment decision rests entirely with the reader, taking into account their own financial circumstances, investment objectives, and risk tolerance.
Frequently Asked Questions (FAQ)
Why did the Bitcoin price rise 21% this week?
The initial trigger was the US Treasury announcement of August 19 that doubled the size limit for long-dated bond repurchases to $4 billion. The market read it as a signal of concern over borrowing costs, and interest shifted toward assets with a limited supply.
What is a short squeeze and why does it matter this week?
A short squeeze occurs when a rising price forces holders of sell positions to close out by buying, so that buying pressure builds without any new interest entering the market. Nearly $4 billion in short positions were force closed from August 19 to 21, so part of last week’s advance originated from this mechanism.
Do the $1.92 billion in ETF inflows mean the annual trend has reversed?
Not yet. Across 2026 to date, spot Bitcoin ETFs still record net outflows of $2.91 billion, so one strong week narrows that deficit without erasing it. The direction of flows over the coming weeks is more informative than a single weekly figure.
References
- CoinMarketCap, “Cryptocurrency Prices, Charts And Market Capitalizations“, CoinMarketCap, data as of August 24, 2026.
- SoSoValue, “Bitcoin ETF Dashboard“, SoSoValue, data as of August 21, 2026.
- U.S. Department of the Treasury, “Treasury Announces Increased Sizes of Nominal Long-End Liquidity Support Buybacks Beginning September 9“, U.S. Department of the Treasury, August 19, 2026.
- Trading Economics, “United States Government Bond Yield“, Trading Economics, accessed August 24, 2026.
- Trading Economics, “United States Inflation Rate“, Trading Economics, July 2026 data.
- CoinDesk, “Bearish Crypto Bets Lose Record $3 Billion as Bitcoin Tops $71,000“, CoinDesk, August 20, 2026.
- CoinDesk, “Bitcoin, Ether and Solana Climb as Another $1 Billion Shorts Get Wiped Out“, CoinDesk, August 21, 2026.
- Yahoo Finance, “Bitcoin and Ethereum ETFs Score Biggest Week Since October with $2.3 Billion“, Yahoo Finance, August 22, 2026.
- Finbold, “BlackRock scooped up over $1.8 billion of these cryptocurrencies in a week“, Finbold, August 22, 2026.
- crypto.news, “Ethena price jumps 65% as Arthur Hayes backs breakout“, crypto.news, August 21, 2026.
- CoinGecko, “Top Crypto Gainers and Losers“, CoinGecko, seven-day data as of August 24, 2026.
- checkonchain, “Short-Term Holder MVRV Ratio“, checkonchain, accessed August 24, 2026.
Related Article
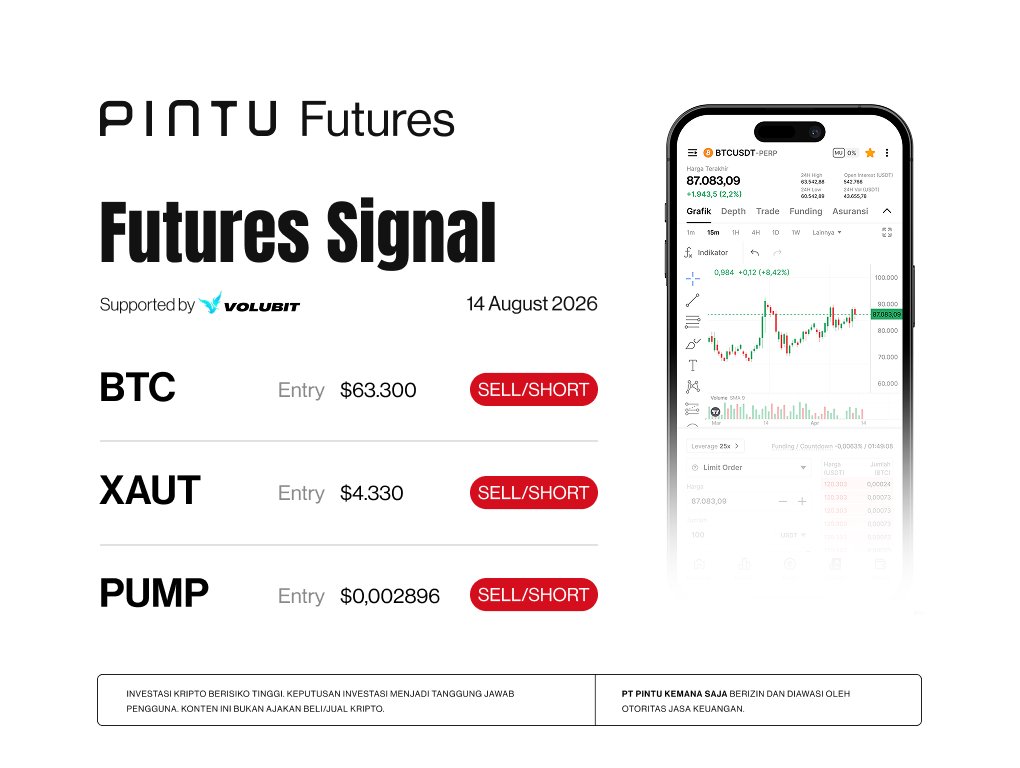
Crypto Futures Signal Pintu X Volubit, Friday, August 14, 2026

How to Buy and Invest in Bitcoin in 2026: Making the Most of Bear Market Momentum

What is Netflix (NFLX) Stock and NFLXon Tokenized Stock?
AAVE
->
ZEC
->
ENA
->
WLFI
->
M
->
Source: pintu.co.id