

Don't want to trade it yourself?
Our desk runs DEX portfolios on profit share.
TradingView says more than100 million traders and investorsuse its platform worldwide, making it one of the biggest names in online market analysis. Itsupports stocks,crypto,forex,futures,andother financial marketsthrough charting tools, technical indicators, screeners, alerts, paper trading, and broker integration.
But popularity doesn’t automatically make it the right choice for you. Therefore, we compared the free plan with the paid plans and examined its main charting tools in this TradingView review. We also compared TradingView with ThinkOrSwim and MetaTrader to help you decide whether it fits your trading style in 2026.
TradingView at a Glance: Scorecard
Below is our TradingView scorecard, covering its charting tools, ease of use, market coverage, pricing, technical analysis, paper trading, broker integration, and overall value for money.
| Category | Score | Verdict |
| Charting Tools | 4.5/5 | Powerful charts, drawing tools, technical indicators, and layouts. |
| Ease of Use | 4.5/5 | The interface is clean enough for new traders but still useful for experienced traders. |
| Market Coverage | 4.5/5 | Supports stocks, ETFs, crypto, forex, futures, commodities, bonds, and major indices. |
| Free Plan | 4/5 | The free basic plan offers useful charting tools and paper trading, but it has limits. |
| Technical Analysis | 4.5/5 | Strong indicator selection, custom indicators, trend lines, and drawing tools. |
| Paper Trading | 4/5 | Useful for practice trading and testing strategies without risking real money. |
| Broker Integration | 3/5 | Supports selected brokers, but trade execution depends on your broker and location. |
| Real-Time Market Data | 3/5 | Available for some markets, but certain exchanges require separate data fees. |
| Social Features | 4/5 | Trade ideas, public scripts, chat rooms, and trader profiles add a useful community layer. |
| Value for Money | 3.5/5 | The free version is good, but paid plans and market data fees can raise the total cost. |
What Is TradingView?
TradingView is a charting platform and trading platform that helps traders and investors study financial markets, track prices, and plan trading strategies. It brings charts, technical analysis, fundamental data, screeners, alerts, paper trading, and selected broker integrations into a single platform.
TradingView was launched in 2011 by Stan Bokov,Constantin Ivanov, and Denis Globa. The founders created it as a web-based platform for viewing charts and analyzing financial markets, then expanded it into a broader service with screeners, alerts, social features, paper trading, and broker connections.
You can use it to follow stocks, ETFs,cryptocurrencies, forex, futures, commodities, bonds, and major indices. The platform combines real-time market data with delayed and historical market data, depending on the market, exchange, and subscription you choose. This makes it useful for comparing currency pairs or studying long-term price movements.
The platform alsosupports custom trading indicators through Pine Script, TradingView’s scripting language. Beyond building your own custom indicators, you can explore tools made by other software developers. Additional trading tools include price alerts, screeners, drawing tools, and a trading panel for supported broker connections.
TradingView doesn’t function as a broker on its own. Through broker integration, such as with Interactive Brokers, you can place trades directly from the platform. Whether you get live trading and full trade execution depends on your broker, location, and account setup.
New traders will find TradingView simple to start with. More advanced users, including experienced, professional, active, and stock traders, often upgrade to a paid plan for additional indicators, more historical data, extra alerts, and deeper access to the platform’s features.
TradingView Review: Key Features
The key features of TradingView are charting tools and indicators, Pine Script, the community library and screener, and the paper trading simulator. Below is a detailed explanation of each one.
1. Charting Tools and Indicators
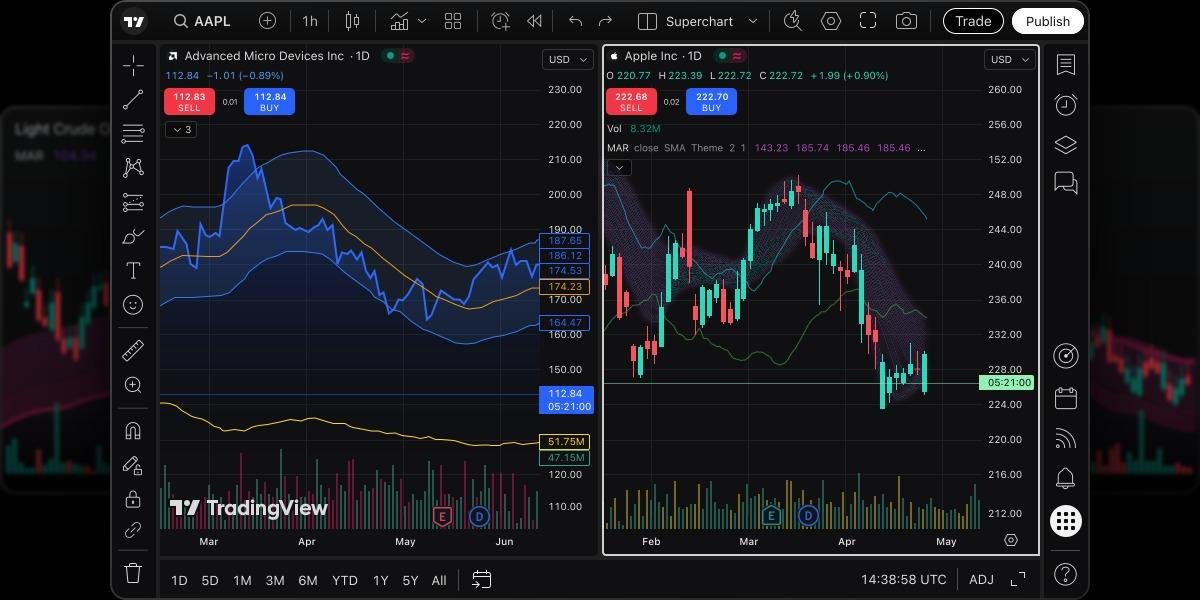
TradingView’s charting tools cover stocks, ETFs, crypto, forex, futures, bonds, commodities, indices, and contracts for difference (CFDs) across international markets.The platform includes more than 400 built-in technical indicators and strategies. These include moving averages, the Relative Strength Index (RSI), Bollinger Bands, MACD, and volume indicators.
The often-cited figure of more than 100,000 custom indicators refers to the broader community library available through Pine Script, not the number of built-in indicators on the platform.
We tested a BTC/USD chart with a 20-period exponential moving average, RSI, and volume. Adding the technical indicators was straightforward: we opened the Indicators menu, searched for each tool, and adjusted the settings directly on the chart. The layout stayed clean, although the extra panels reduced the space available for the price chart.
TradingView also lets you change chart types, draw a trend line, compare symbols, and save layouts for later.The number of charts you can display at once depends on your plan, so the free plan may feel restrictive if you want to monitor multiple chartsor compare several timeframes.
The charting experience works for both new traders and experienced traders. Beginners can start with one or two indicators, while active traders can combine several trading tools to study trends, momentum, and volume. Still, adding more indicators per chart doesn’t automatically improve a strategy; too many signals can make a chart harder to read and lead to poor decisions.
2. Pine Script and the Community Library
Pine Script is TradingView’s built-in programming language for creating custom indicators, trading strategies, and screeners. The current version, Pine Script v6, enables software developers and advanced users to build tools that match a specific trading style or analytical method.
Thecommunity library contains more than 100,000 user-created scripts. You can browse these custom trading indicators, add them to your charts, and use many of them for free without writing code yourself.
These scripts can help you test new ideas, identify patterns, or create rules for different trading strategies. Some also include theirsuit your needs
The library is useful, but not every script is reliable. Before using one for live trading, check what it measures, review its settings, and try it with paper trading first. A script can support your analysis, but it can’t guarantee a profit or replace proper risk management.
3. Screener and Paper Trading Simulator
TradingView’s stock screener, crypto screener, and forex screener help you narrow down assets from one interface. You can filter US stocks, international equities, ETFs, crypto, and forex by price, volume, market capitalization, sector, and other criteria.
The screener also supports technical and fundamental filters. For example, you can findstocks trading above their 200-day moving average,identify RSI divergence, orfilter companiesby the price-to-earnings (P/E) ratio and earnings-per-share (EPS) growth. These filters make it easier to narrow a broad market list to a smaller set of potential trading opportunities.
TradingView also includes apaper trading simulatoron every plan, including the free plan. You can use it to practice entering and closing positions, test different trading strategies, and track how decisions affect a simulated account without risking real capital.
You can reset the simulator whenever you want, which makes it useful for testing a new approach from the beginning. However, paper results may differ from live trading because simulated orders don’t fully reproduce factors such as market liquidity, slippage, and emotional pressure.
4. Social Trading and Ideas
TradingView’s trade ideas feedadds a social layer to its charting tools. Users canpublish and browse market analysis, explain potential setups, and share views on assetssuch as stocks, crypto, and forex.
You can also join chat rooms organized around specific markets, including crypto, stocks, and currency pairs. This gives you a place to compare different approaches and see how other traders interpret the same market movement.
The platform lets you follow specific traders whose methods match your goals or trading style. Their published ideas can help you understand how they use charts, indicators, and trading strategies.
This feature sets TradingView apart from purely functional charting platforms without a social layer. However, you shouldn’t copy an idea simply because it has many likes or followers. Check the reasoning, timeframe, profit target, and risk management behind each setup before making your own decision.
TradingView Pricing: 5 Tiers Compared
TradingView offers five plans, ranging from the free Basic tier to the higher-priced Ultimate plan. The main differences come down to the number of charts and indicators you can use, historical data limits, alerts, and access to advanced trading tools. Here is a comparison table of TradingView’s five pricing tiers and what you get with each one.
| Plan | Monthly price | Charts per tab | Indicators per chart | Historical bars | Parallel Chart Connections | Price Alerts | Watchlist Alerts |
| Basic | $0 | 1 | 2 | 5k | 1 | 3 | 0 |
| Essential | $14.95/mo | 2 | 5 | 10k | 10 | 20 | 0 |
| Plus | $34.95/mo | 4 | 10 | 10k | 20 | 100 | 0 |
| Premium | $69.95/mo | 8 | 25 | 20k | 50 | 400 | 2 |
| Ultimate | $239.95/mo | 16 | 50 | 40k | 200 | 1000 | 15 |
The Hidden Cost: Market Data Fees
The price of a TradingView plan isn’t always the full cost of accessing live markets. Real-time United States (US) stock and futures market data incurs an additional charge and is billed separately from your subscription.
This matters if you’re a stock or futures trader who needs live prices rather than delayed quotes. Your total TradingView cost may therefore be higher than the advertised price, especially when your trading strategies depend on rapid price changes, accurate price alerts, or timely trade execution.
TradingView allows users with a paid plan or active trial to add real-time and intraday data for individual exchanges. These can include theNational Association of Securities Dealers Automated Quotations(NASDAQ), New York Stock Exchange (NYSE), New York Stock Exchange Arca (NYSE Arca), over-the-counter (OTC) markets, and the Chicago Mercantile Exchange (CME).
The exact fee depends on the exchange and whether you qualify as a professional market-data user.
This separate fee structure is a recurring criticism because the TradingView subscription price can appear to be the total cost at first glance.Some competing trading platforms bundle certain data access into their subscriptions, while TradingView separates its charting platform fee from exchange charges.
So treat the listed plan price as the cost of the software, not necessarily the complete cost of real-time data. Check the relevant exchange fee before subscribing, particularly if you need live prices for financial markets, futures, or stocks rather than delayed market data
Where TradingView Falls Short
TradingView has many advantages, but it also falls short in a few areas, including advanced features that cost more, real-time market data fees, limited options trading tools, varying broker integrations, and community ideas that require careful checking.
- Advanced features cost more:TradingView’s free plan is useful for basic charting and practice trading, but limits on charts, indicators, alerts, and historical data can push budget-conscious users toward a paid plan.
- Market data costs extra:Stock traders and futures traders may need to pay separate exchange fees for real-time market data. This can raise the total cost beyond the advertised TradingView pricing, especially for users who need live prices for trading strategies or trade execution.
- Options trading is limited:TradingView isn’t a dedicated options trading platform. It provides charting, market data, analysis, and social features for options traders, but it doesn’t offer the same options-specific tools or execution features as a specialized options platform.
- Broker integration varies:TradingView broker integration depends on the broker, region, and account type. You may be able to analyze markets on TradingView but still need to use your broker’s platform to place trades or manage complex positions.
- Community ideas need checking:Trade ideas from other traders can support research, but they aren’t guaranteed recommendations. You should review the evidence, timeframe, profit target, and risk management behind an idea before using it.
These trade-offs don’t cancel out what TradingView does well. Its charting tools, custom trading indicators, broad market coverage, paper trading, price alerts, and broker integration still make it a strong choice for traders and investors seeking a single platform for research, analysis, and practice.
What Real Users Are Saying
User feedback on TradingView is mixed. Users often praise its interface, charting tools, customization, and technical analysis. Meanwhile, negative reviews often cite billing, customer support, and subscription issues. We’ve compared what users like and where the platform receives criticism.
| Review Source | Rating | What Users Like | Common Complaints |
| G2 | 4.5/5 from 75 reviews | User-friendly charts, market analysis, reporting, and integration options | Some users want stronger support and broader trading functions. |
| Trustpilot | Considerably more negative sentiment | Some customers value the platform and its market features | Billing, account access, cancellations, and customer service are common concerns. The page shows 1,303 reviews, including 294 posted in the previous 12 months. |
| Independent Reviews | Mixed, ranging from positive to critical | Customizable charts, alerts, broad market coverage, and ease of use | TradingView pricing, paid features, and separate real-time market data fees are recurring concerns. |
| Mobile app reviews | Highly positive in available app store data | Convenient mobile apps, synced watchlists, and chart access | Some users report limitations in support and features. |
TradingView vs ThinkOrSwim
TradingView and ThinkOrSwim cater to different kinds of traders. For those focused on technical analysis, TradingView has the edge with its multi-asset charts, community trade ideas, and broker integration. That combination, particularly its charting tools, is why it ranks first on our list of the best crypto trading tools.
On the flip side,ThinkOrSwim is better suited to United States stock and options traders who want advanced analysis and integrated trade execution.
Here is a comparison table of TradingView and ThinkOrSwim’s key features, pricing, tools, market coverage, and trading capabilities.
| Features | TradingView | ThinkOrSwim |
| Main strength | Charting platform with broad market coverage, custom indicators, and social features | Brokerage-focused platform with advanced stock, options, and futures tools |
| Pricing | Free plan available; paid TradingView plans start at $12.95/month when billed annually | Free for customers with an eligible Charles Schwab brokerage account |
| Charting Tools | Cleaner interface, flexible layouts, multiple charts, and strong visual customization | Powerful charts, but the interface can feel more complex |
| Market Coverage | Stocks, ETFs, crypto, forex, futures, commodities, bonds, and indices | Strong focus on US stocks, options, and futures; less suitable for crypto markets |
| Custom Scripting | Pine Script for custom trading indicators, screeners, and strategies | thinkScript for custom studies, scans, and trading tools |
| Options Analysis | Useful charts and data, but limited options-specific tools | Stronger options chains, risk analysis, probability tools, and strategy analysis |
| Broker Integration | Connects with selected brokers, including Interactive Brokers and others | Built around Charles Schwab brokerage integration |
| Trade Execution | Available through supported brokers, with features depending on the connection | Direct execution through the linked Schwab account |
| Social Features | Public Ideas feed, community scripts, trader profiles, and comments | Limited social features and no comparable public Ideas feed |
| Best For | Traders who want one platform for several markets, charting, and research | Active US options traders who want brokerage-grade execution and options tools |
TradingView vs MetaTrader
TradingView and MetaTrader suit different trading styles. With its emphasis on visual charting, market analysis, and social features, TradingView is particularly well suited to traders who value an intuitive, research-focused platform.
In contrast,MetaTrader is stronger for direct broker access, forex trading, and automated strategies. Below is a comparison table showing how the two trading platforms differ.
| Feature | TradingView | MetaTrader |
| Main Purpose | Charting, technical analysis, market research, and social trading | Direct trading, forex execution, and automated trading |
| Cost | Free plan available; paid plans add advanced tools | Usually free through a broker |
| Market Coverage | Stocks, ETFs, crypto, forex, futures, commodities, bonds, and indices | Mainly forex and contracts for difference (CFDs), with other markets depending on the broker |
| Charting | Modern interface with advanced charting tools and flexible layouts | Functional charts with fewer built-in visual features |
| Technical Indicators | More than 400 built-in indicators and access to community scripts | MetaTrader 4 includes about 30 built-in indicators; MetaTrader 5 includes about 38 |
| Custom Indicators | Pine Script | MQL4 or MQL5 for custom indicators, scripts, and automated systems |
| Automated Trading | Limited automation through alerts, webhooks, and supported broker features | Expert Advisors enable direct automated trading |
| Broker Integration | Connects to selected brokers, depending on region | Closely linked to the broker providing the MetaTrader account |
| Trade Execution | Available through selected broker connections | Built for direct trade execution through the connected broker |
| Social Features | Ideas, public scripts, trader profiles, comments, and community discussions | More limited social features |
| Best For | Traders who want broad market coverage, visual analysis, and an accessible charting platform | Forex traders and users who prioritize automation and broker direct execution |
Who Should Use TradingView?
TradingView works for different types of traders, but its usefulness depends on what you need from a trading platform. Whether you follow several markets, rely heavily on technical analysis, or want automated execution, the right choice comes down to the tools, data, and trading features you need. Here’s who TradingView is best suited for.
- Traders across multiple markets:TradingView suits users who track stocks, crypto, and forex, making it easier to manage different research workflows in one place. For example, some of thebest cryptocurrency exchangesintegrate TradingView into their trading interfaces, making it easier for crypto traders to access it without switching to a different app from the one they are familiar with.
- Traders focused on technical analysis:The platform works well for users who rely on charts, technical indicators, alerts, trend lines, and other trading tools when planning trades.
- Budget-conscious beginners:The free plan is genuinely useful for learning, charting, and paper trading. However, beginners who later need real-time market data for US stocks or futures should budget for possible exchange fees.
- Experienced and active traders:Users who need multiple charts, more indicators, larger watchlists, more alerts, and additional historical data may benefit from a paid plan.
- Algorithmic and forex-focused traders:MetaTrader may be a better fit for those who need direct broker access to automated execution via Expert Advisors. TradingView is more suitable for analysis and charting unless its available broker integration supports the execution features you need.
- Traders who value community research:TradingView suits users who want to browse trade ideas, study public scripts, and follow other traders. You should still verify each idea and apply your own risk management before placing a trade.
Final Verdict: Is TradingView Worth It in 2026?
TradingView is worth it in 2026 if you wantone charting platform for stocks, crypto, forex, and other financial markets. Its strong charting tools, custom indicators, screeners, paper trading, alerts, and selected broker integrations make it useful for both new and experienced traders.
The free plan is a good place to start because it includes basic charting and practice trading without an upfront cost. After using the free plan for some time, the paid plan becomes worthwhile when you need multiple charts, more indicators, additional alerts, or more historical data.
Is TradingView Trustworthy?
TradingView is a legitimate market-analysis platform used for charting, screeners, alerts, and simulated trading. However, it isn’t a broker, and its community trade ideas shouldn’t be treated as professional recommendations. User feedback is mixed, with positive comments about the platform and negative reviews often focused on billing and customer support.
Is It Worth Paying For TradingView?
It can be worth paying for TradingView if you need more charts, indicators, alerts, or historical data than the free plan allows. The Essential plan starts at $12.95 per month when billed annually, but you should also account for separate real-time market data fees where applicable.
What’s Better Than TradingView?
There isn’t one platform that’s better for every trader. MetaTrader may be a better choice for forex traders who need automated trading through Expert Advisors, while ThinkOrSwim may suit US stock and options traders who want advanced options analysis and broker-linked execution. TradingView remains stronger for broad market coverage, visual charting, and community features.
Is TradingView Good For Beginners?
Yes. TradingView is suitable for beginners because its free version provides basic charts, technical indicators, screeners, alerts, and paper trading. New traders can use a paper trading account to practice strategies without risking real money, although the platform’s feature limits may become restrictive as their needs grow.
Is TradingView Free?
Yes. The Basic plan costs $0 and includes one chart per tab, two indicators per chart, three price alerts, and limited allowances for the watchlist and historical data. Paid plans add higher limits and advanced features.
Is TradingView A Broker?
No. TradingView provides market analysis and can connect to selected brokers, but it doesn’t replace a broker account. Whether you can place trades through its interface depends on the available broker integration, your broker, and your location.
Source: memeburn.com
3 Comments
Pingback: Bitcoin Pulls Back After Approaching $80K — Can Massive ETF Inflows Absorb the Selling Pressure Above? – xpertsstudio
Pingback: Ethereum Has 66 Ideas, Visa Wants Stablecoin Rails, and Solana Cuts Transaction Times – xpertsstudio
Pingback: BTC Breaks $80,000 Mark, What Does It Mean? – xpertsstudio