


Don't want to trade it yourself?
Our desk runs DEX portfolios on profit share.
As of August 20, 2026, <a href="https://xpertsstudio.com/bitcoin-rally-meets-spot-bitcoin-etf-outflows-and-bullish-news/” title=”Bitcoin Rally Meets Spot Bitcoin ETF Outflows and Bullish News”>Bitcoin today trades near $72,736 — firmly above the $70,000 mark it last touched in June. A sharp, news-driven repricing fueled by legislative momentum and a friendlier rate environment has pushed $BTC into overbought territory, raising questions about the rally’s sustainability.
Key takeaways
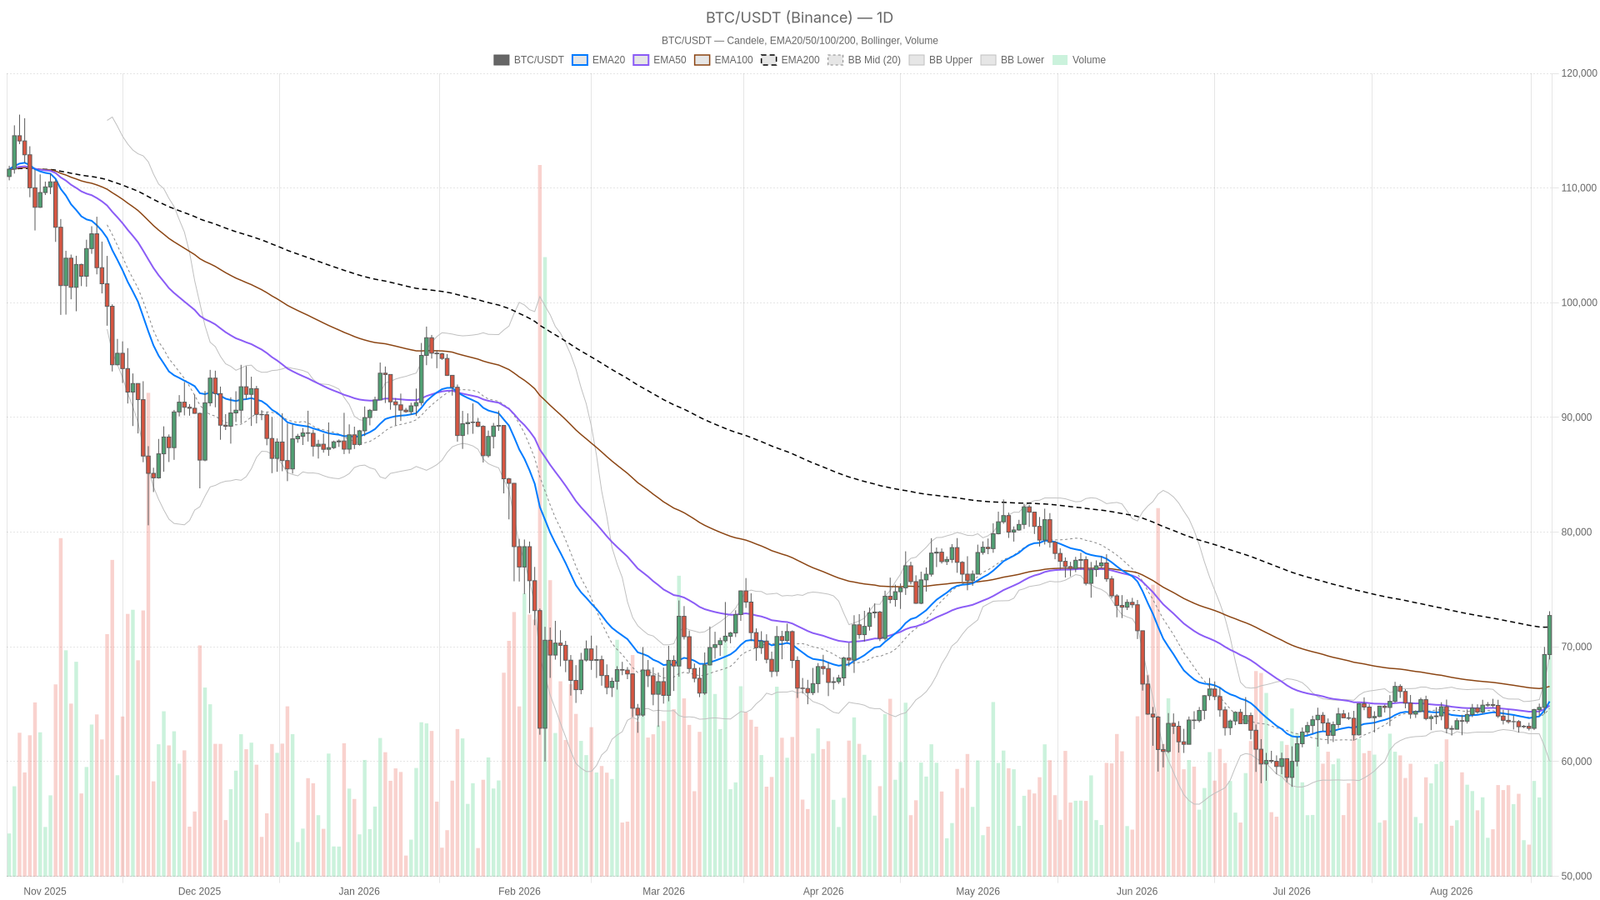
- Bitcoin surged 12% in two days, breaking above $70,000 for the first time since June 2026
- Daily RSI at 79.91 signals deeply overbought conditions, while MACD confirms strong bullish momentum is still building
- Total crypto market cap stands at roughly $2.476 trillion with Bitcoin dominance climbing to 58.7%
- Price is trading above the daily 200 EMA, marking a meaningful structural shift in the macro trend
- Fear & Greed Index at 62 (“Greed”) reflects aggressively bullish sentiment
Daily Breakout vs Overbought Signals
Bitcoin has pushed decisively above the 200 EMA at 71,728 — the level that defines the macro trend — signaling a meaningful structural shift. For months the 200 EMA acted as a ceiling; now it sits underneath price, confirming the breakout is real rather than a false move. The 20 and 50 EMAs at 65,248 and 64,890 remain far below current price, which is typical of a fast breakout rather than a slow trend continuation.
However, the daily RSI at 79.91 sits deep in overbought territory, and the MACD histogram at 783.81 — with the MACD line at 983.13 versus the signal at 199.32 — confirms strong bullish momentum is still building rather than fading. The tension here is worth flagging: the system’s regime tag on the daily still reads “neutral,” which is essentially a lagging artifact, since the breakout is too fresh for the broader trend classification to have caught up.
Bollinger Bands add another layer. The daily upper band sits at 69,241.90, and price is now trading above it entirely, with the mid-band at 64,634.76. Being outside the upper band signals a trending, momentum-driven move — but it is also stretched. Mean reversion risk increases the longer price rides outside the band, even in a genuine uptrend. Daily ATR of 1,613.85 confirms volatility has expanded meaningfully.
Moreover, pivot structure reinforces the bullish tilt: price is trading above the pivot point at 71,582.97, with resistance at R1 at 74,263.73 now the next real target. Support at S1 at 70,055.25 marks where the breakout thesis would start to look shaky. This setup keeps the bias upward but leaves clear levels to monitor on any pullback.
1H and 15m: Momentum Cooling Inside the Uptrend
The hourly trend remains structurally bullish with a clean EMA stack — EMA20 at 71,293.69 above EMA50 at 68,993.37 above EMA200 at 65,679.37 — but short-term momentum indicators are showing the first signs of cooling. The RSI at 77.8 is still overbought, and the MACD histogram has flipped negative at -51.53, with the MACD line at 1,313.9 now below its signal at 1,365.43. That is a short-term momentum stall inside an intact uptrend, not a reversal signal on its own.
Price currently trades just under the 1H pivot at 72,824.71, boxed between R1 at 73,019.41 and S1 at 72,538.71 — a tight range that reads as consolidation after the initial spike, not indecision about direction. The hourly Bollinger Bands show price sitting below the upper band at 73,925.66 rather than riding it, which is a healthier position than the daily chart’s stretched extension.
Meanwhile, the 15-minute chart offers a more neutral picture: RSI has cooled to 59.76 and the MACD histogram is only mildly negative at -29.65. Price is hugging the midline of a narrow Bollinger range, with pivot resistance and support just points away at 72,769.33 and 72,715.33. This is pure execution territory — the market is digesting the move in a tight band while larger daily and hourly structures determine what comes next.
Bullish and Bearish Scenarios
The bullish case hinges on Bitcoin holding above the daily 200 EMA at 71,728 and clearing resistance toward R1 at 74,263.73, which would confirm the breakout and turn overbought RSI readings into a feature of strong momentum. A hold above the 1H pivot at 72,824.71 with the MACD histogram flipping positive would be the clearest sign that short-term buyers have absorbed initial profit-taking. Continued dominance gains and a Fear & Greed reading holding in “Greed” without spiking into extreme euphoria would support this scenario.
That said, the bearish case centers on the daily RSI near 80 and price trading outside the upper Bollinger Band — both classic setups for a pullback even within a larger uptrend. If price loses the daily pivot at 71,582.97 and slips toward S1 at 70,055.25, the breakout above the 200 EMA would come into question. A break below the 1H EMA20 at 71,293.69 would be the first tell that the hourly trend is losing its grip, and a failure to reclaim the 15m pivot zone around 72,746.66 on any bounce would add weight to a deeper retracement.
Positioning and Risk
The daily chart tells a genuine breakout story backed by real catalysts, but overbought conditions on multiple timeframes demand caution. The market is defined by conviction and stretch simultaneously, and both forces will shape the next move. The tight 15-minute range suggests the market itself is undecided about the next few hours, even as the bigger picture leans bullish. Volatility has clearly expanded, as the jump in daily ATR shows, and that cuts both ways.
Anyone tracking Bitcoin today should weigh the strength of the macro catalyst against how extended price already looks on shorter timeframes. Sentiment readings in “Greed” territory have a habit of shifting quickly once price stalls. The hourly MACD turning negative while the daily RSI hovers near 80 creates a genuine tension — one that makes the coming sessions critical for determining whether this breakout has room to run or needs to cool off first.
Why did Bitcoin surge above $70,000?
The rally was driven by renewed legislative momentum around the Clarity Act and a friendlier rate environment, as Total crypto market cap expanded to roughly $2.476 trillion, with Bitcoin dominance climbing to 58.7%, signaling capital rotation into $BTC specifically rather than spreading across the broader market
Is Bitcoin overbought at current levels?
Yes. The daily RSI sits at 79.91 and the hourly RSI at 77.8, both deep in overbought territory. Price is also trading above the daily upper Bollinger Band, a classic sign of a stretched, momentum-driven move that carries elevated mean reversion risk the longer it persists without a consolidation phase.
What are the key support and resistance levels to watch?
Key support sits at the daily pivot of 71,582.97 and S1 at 70,055.25, where the breakout thesis would begin to weaken. Resistance targets include R1 at 74,263.73, while the daily 200 EMA at 71,728 now serves as a critical floor that must hold to keep the broader bullish structure intact.
Disclaimer: This article is for informational purposes only and does not constitute financial advice, an investment recommendation, or a solicitation to buy or sell any financial instrument or cryptocurrency. The analysis provided is not indicative of future results. Investing in crypto assets and financial markets carries a high risk of capital loss. Always do your own research (DYOR) and consult a qualified financial advisor before making any decision.
Article produced with the assistance of artificial intelligence and reviewed by the editorial team.
Source: cryptonews.net