


Don't want to trade it yourself?
Our desk runs DEX portfolios on profit share.
Currencies38622
Market Cap$ 2.56T+6.77%
24h Spot Volume$ 62.10B+28.1%
DominanceBTC56.82%-0.41%ETH10.96%+4.08%
ETH Gas0.10 Gwei
MarketBitcoinAnalysisTop StoriesBitcoin Price Prediction
Aug 20, 2026
3min read
byGlory Kaburu
forThe Coin Republic

Bitcoin trades near $69,800 after breaking above its recent range and reclaiming the Glassnode-tracked short-term holder cost basis at $68,500, putting recent buyers in aggregate profit and setting a near-term target of $73,674. Glassnode’s True Market Mean near $75,800 marks broader active-investor resistance and a sustained close above $70,000 plus stronger US spot ETF demand would be needed to confirm further crypto upside. Risks include heavy short-term holder profit-taking (over 44,300 BTC moved to exchanges), short liquidations driving the surge, and a failure of $64,000 that could activate a bear-flag target below $50,000.
See what traders are focused on

Key Insights:
- Bitcoin price prediction points to $73,674 after BTC reclaims $68,500.
- Glassnode places broader active-investor resistance near $75,800.
- Losing the $64,000 level could trigger a bear flag target below $50,000.
Bitcoin trades near $69,800 after breaking from its recent range and briefly touching $70,000. The move carries the asset above the $68,500 short-term holder cost basis tracked by Glassnode. That reclaim places recent buyers back in aggregate profit and strengthens the near-term structure.
The Bitcoin price prediction now centers on $73,674.Michaël van de Poppe identifies it as the next major liquidity zone. Yet bulls first need to hold the breakout above $68,500 and nearby technical resistance.
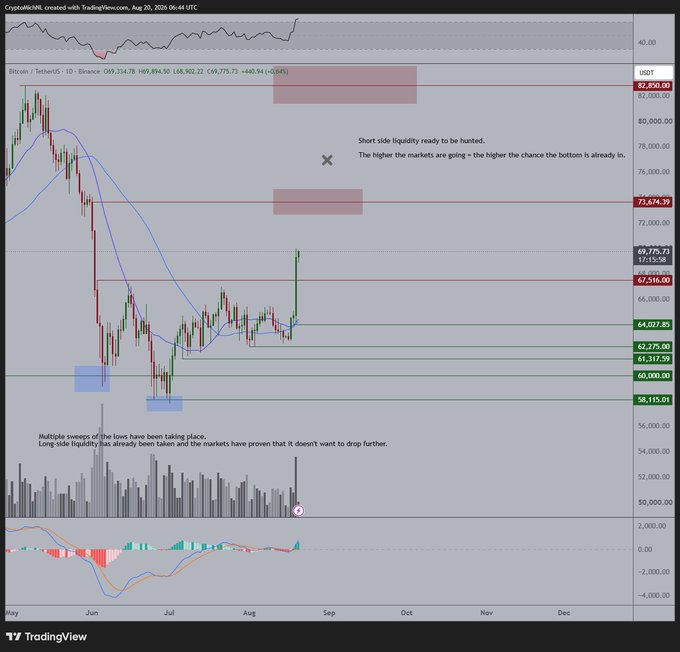
The price of bitcoin also faces a broader recovery barrier near $75,800. Treasury bond buybacks pushed yields lower and helped accelerate the move, driven by heavy short liquidations.
Bitcoin Price Prediction Tracks the $73,674 Target
Van de Poppe previously marked $65,800 as Bitcoin’s first resistance after weeks of narrow trading. His chart placed the stronger overhead zone at $73,674, where short-side liquidity had accumulated.
BTC has now cleared the first level and traded above $69,000. The Bitcoin price prediction turns $73,674 into the next visible target for bulls. From $69,800, the level sits about 5.5% higher.
For the Bitcoin price prediction, a sustained close above $70,000 would show buyers absorbed supply near the psychological barrier. It would also keep the breakout structure intact above the former range ceiling.
The BTC move still needs spot demand, as forced short covering drove much of the initial surge. Losing $68,500 would place the price back below the average cost of recent buyers. The bearish Bitcoin price prediction gains weight if that level fails.
Bitcoin Price Prediction Meets the Wider $75,800 Test
Glassnode’s August 19 report placed the short-term holder cost basis at $68,500. It also identified the True Market Mean at $75,800, reflecting the broader active investor base.
Glassnode published those readings before the latest surge, when spot traded below both measures. The rally now changes the first test but leaves the larger structural hurdle untouched.
This Bitcoin price prediction depends on whether $68,500 becomes support during any retest. Holding that level could extend the move toward $73,674 and then $75,800.
Yet Glassnode’s broader recovery signals still show caution. Its 90-day Realized Profit/Loss Ratio stands at 0.75, below the 2.0 recovery threshold. Perpetual demand has turned positive, while the Coinbase premium stays negative.
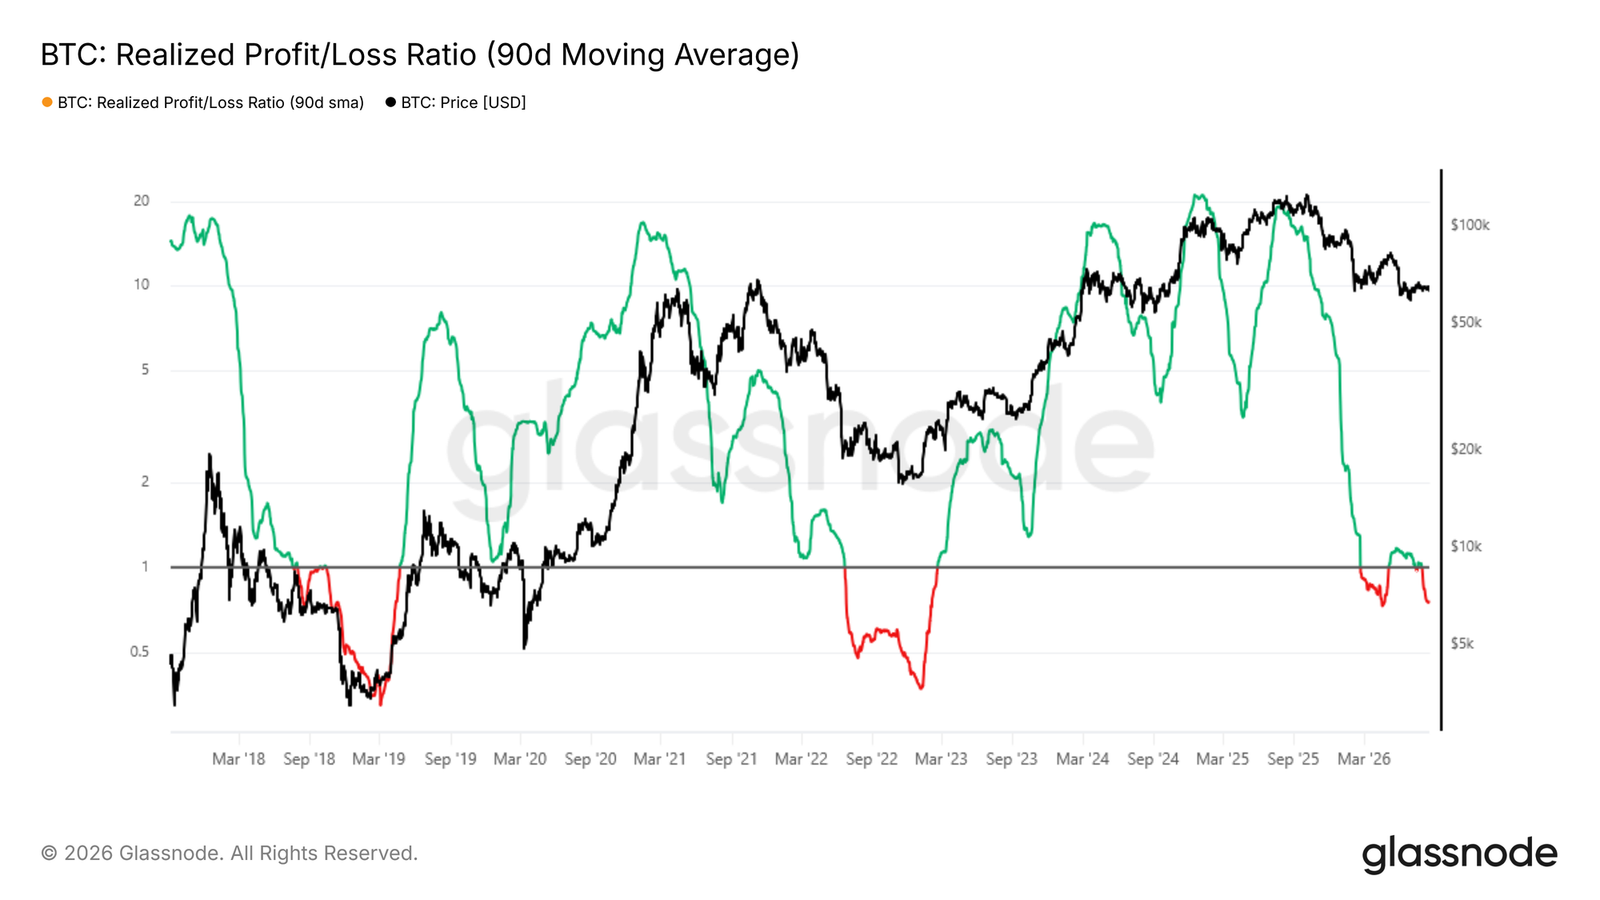
ETF flows have stabilized after daily outflows reached roughly 5,000 BTC at the trough. The Bitcoin price prediction also requires stronger US spot buying beyond liquidation-driven demand. That support would give the price of bitcoin a firmer base.
Profit Taking Raises the Risk Near the $70,000 Zone
Short-term holders sent more than 44,300 BTC in profit to exchanges during the rally, according toCryptoQuant. The transfer marked their largest profit-taking event of 2026.
Exchange deposits can increase the liquid supply, although transfers do not confirm immediate sales. The activity arrives while theBTC crypto markettests dense resistance near $69,000 to $70,000.
BTC price analysis links that zone to a filled monthly imbalance, the 200-week EMA, and the bull-market support band. A rejection there could push the price of bitcoin toward $63,000 to $64,000.
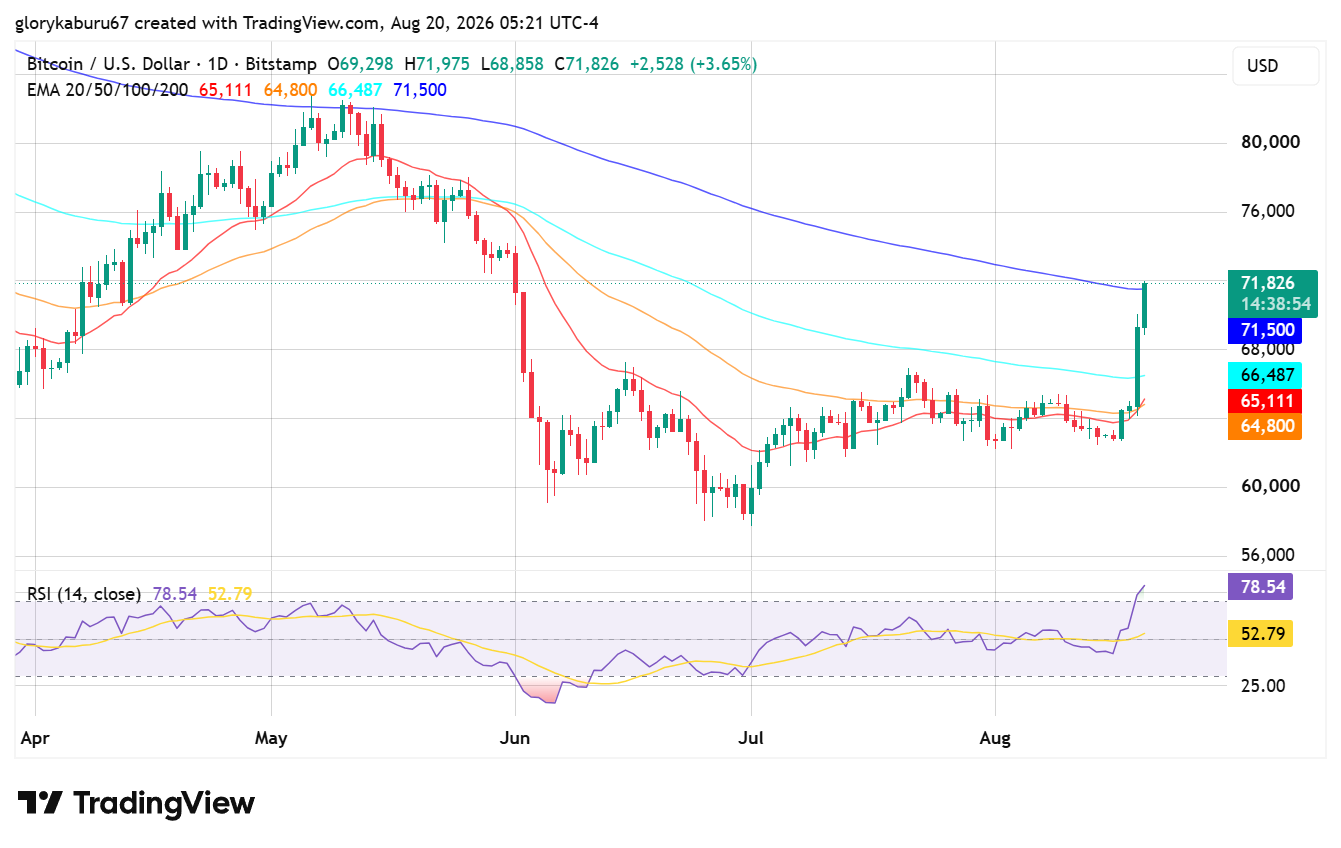
That support area also aligns with shorter moving averages and the lower boundary of a possible bear flag. A decisive close below $64,000 could activate a measured target below $50,000.
A weekly close above the resistance band would weaken that bearish setup. A successful retest could then open the $76,000-$80,000 range. Glassnode’s $75,800 marker sits near the lower edge.
Source: cryptorank.io